ENTERPRISE SYSTEMS · OPERATIONAL UX
TOMONI Hub
Client
Mitsubishi Power
Role
Interactive Designer (UX/UI and Voice UI)
Timeline
2021–2022
Platform
Enterprise Operational Intelligence Platform

145+
Connected power plants
Platform scale, published by AVEVA
30+
Voice command types
TOMONI Voice, published by NTT DATA
24/7
Remote monitoring and support
Global TOMONI HUB centers, published by AVEVA
My role
One of two designers on Vectorform's team. I designed the voice command logic, OCR document search, weather alerts, and main dashboard, and made the case that moved Vectorform's design team to Figma.
Team
Product · UX Research · Design · Engineering · SMEs · Client Stakeholders
Scope
UX Design · UI Design · Information Architecture · Voice Interaction Design · Design System Contributions · Stakeholder Presentations · Implementation Support
Tools
Sketch · Zeplin · Figma · Confluence · Jira
Project details are limited to publicly shareable information and portfolio-safe materials.
01 Context
TOMONI had to pull a lot of operational information together in one place.
Mitsubishi Power's TOMONI Hub supported teams monitoring and maintaining power-generation equipment across a large distributed network. Operators worked with equipment data, alarms, maintenance information, technical documentation, weather, and other plant systems while making decisions that could require both speed and precision.
There was a lot of information in the platform because there was a lot of information in the work. Operators still needed that technical depth. My work focused on making it easier to reach, understand, and move between the information connected to the task they were already working through.
I worked from the existing research, operational requirements, stakeholder input, and power-generation subject-matter experts, and helped carry the work forward through interface design, workflow definition, voice interaction, and implementation.

TOMONI Hub connected power-generation facilities with remote monitoring and technical support across multiple regions.

TOMONI supported teams monitoring and maintaining complex power-generation equipment across distributed plant environments.
02 Discovery
I was stepping into a product that already had a lot going on.
I started by getting familiar with the product, the existing requirements, and the decisions that had already been made. I looked for the places where operators still had to piece information together, switch between parts of the platform, or work through interaction details that were not fully resolved yet.
Discovery 01
There was a lot of information competing for attention.
Plant teams could need equipment health, alarms, performance trends, maintenance status, technical documentation, and supporting information during the same investigation. That meant the hierarchy had to do real work. The current condition or answer needed to be easy to find, while the deeper technical information still needed to be there when someone wanted to investigate further.
Discovery 02
Related information still lived in different places.
Operational data, maintenance information, and technical documents did not always sit together naturally. Someone investigating one issue could end up moving between several parts of the platform to understand what was happening. I mapped the relationships between those sources so the experience could carry more of that context forward.
Discovery 03
Voice had to work with the interface, not replace it.
A spoken response worked well for a quick question. A trend, technical document, table, diagram, or equipment history usually needed a screen. That made voice useful as another way into the product. Someone could ask for information naturally, get to the right place faster, and continue working visually when the answer needed more structure.
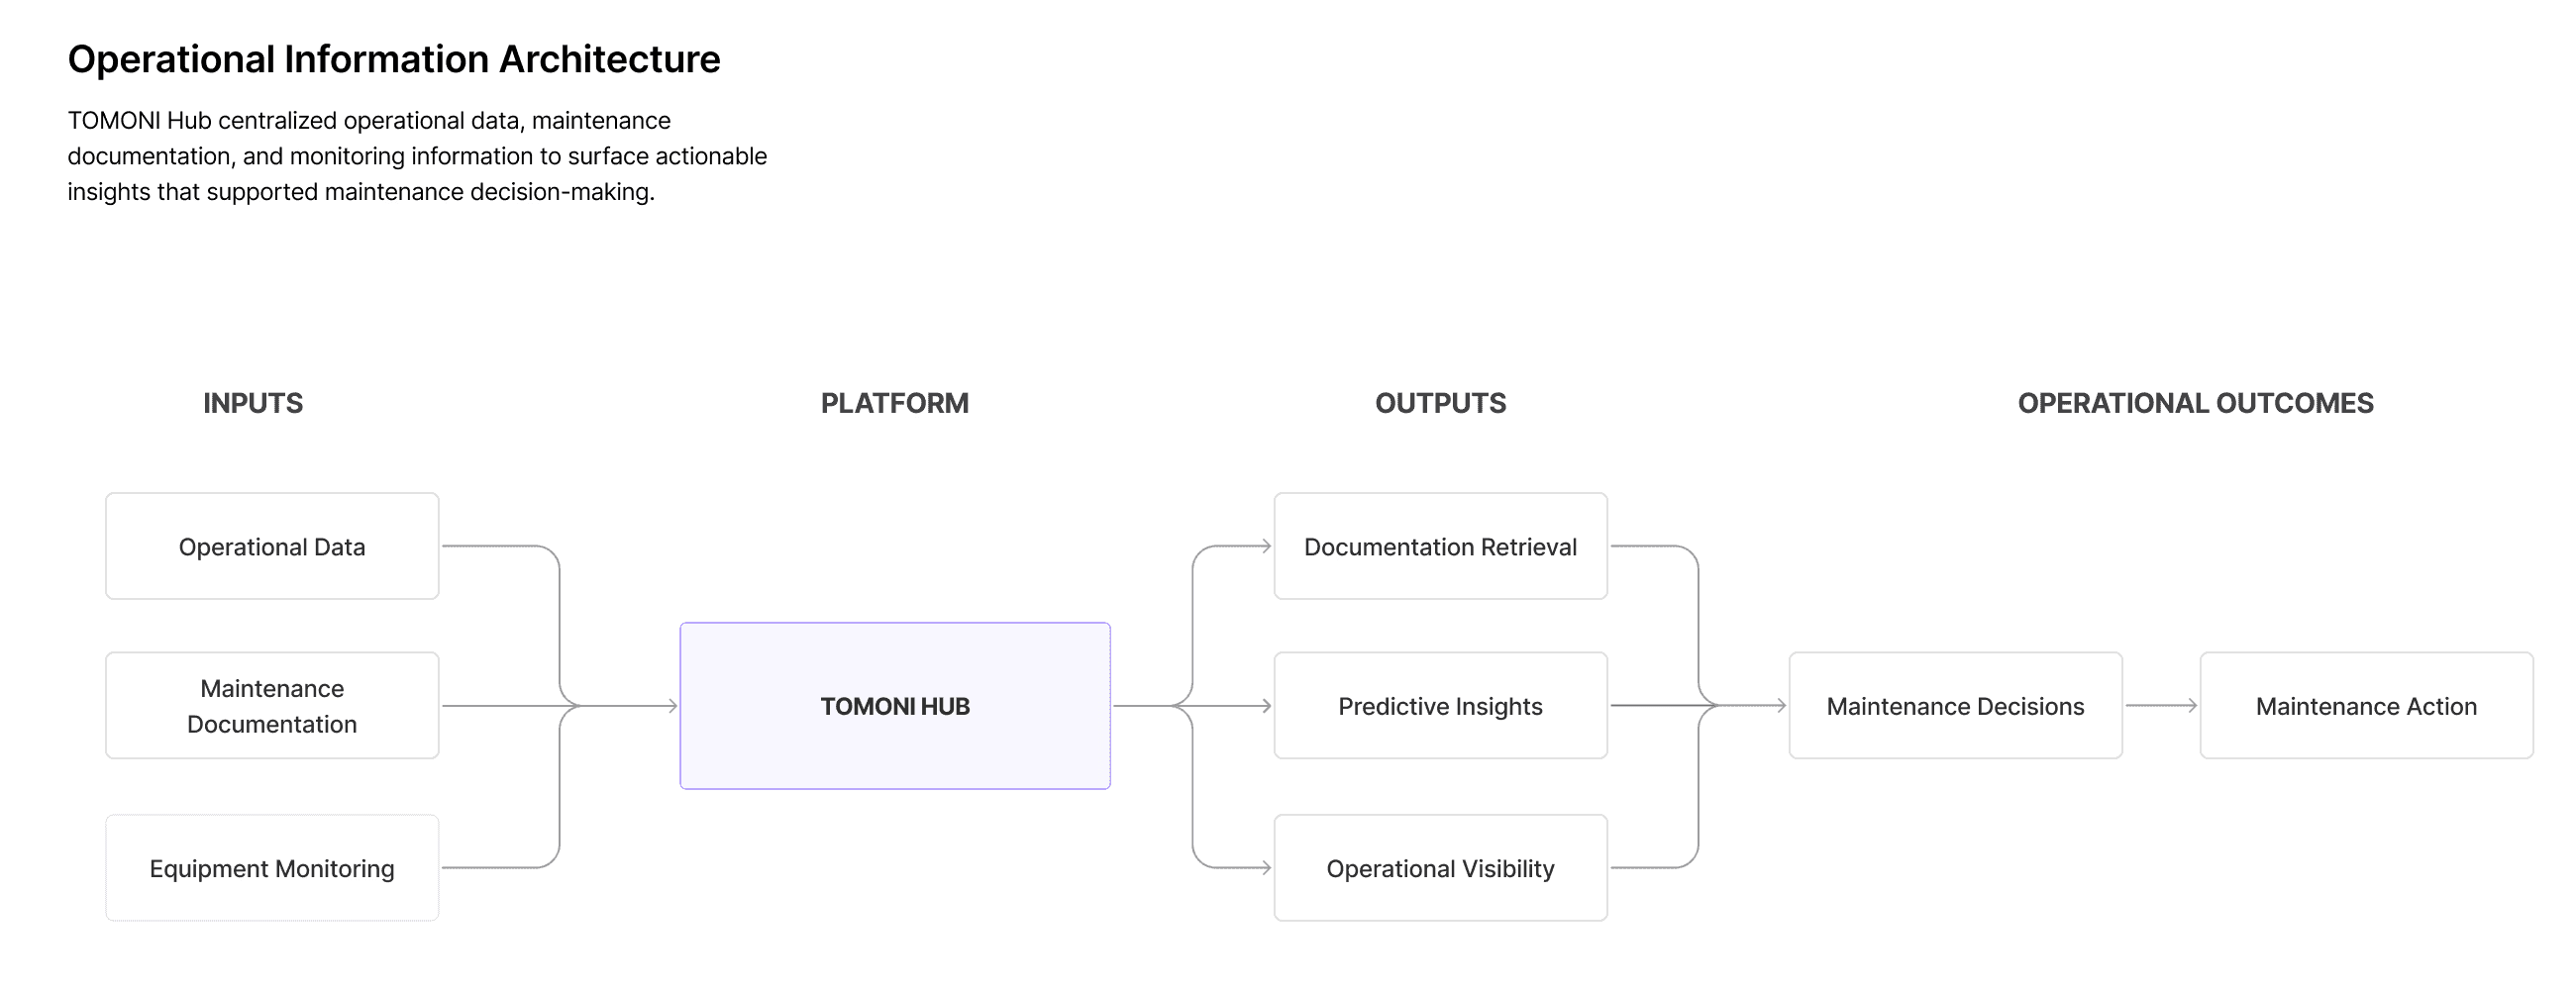
Mapping the information architecture helped me understand how operational data, maintenance documentation, and equipment monitoring connected during technical work.

Questions around document organization and search behavior exposed interaction details that were not resolved by the existing requirements.
03 Decisions
Keep the information connected as the user moved from question to investigation.
A lot of the design work came down to what happened after someone received an answer.
Could they ask another question without starting over? Could they see enough information to understand the result? Could they move from an operational value into the documentation behind it?
Decision 01
Preserve context across follow-up questions.
Operators often needed to refine a request instead of starting a new one. I designed flows that carried the active subject, document, or equipment context into follow-up questions so users did not have to keep repeating information the system had already been given.
Tradeoff 01
The system had to keep track of the active subject, document, or equipment between questions, which added states engineering had to handle.
Decision 02
Treat voice and visual interaction as one workflow.
A spoken question could surface an answer quickly, but operators still needed trends, history, supporting information, and follow-up paths to make sense of it. Voice requests returned structured visual responses so the user could keep investigating without having to restart the task in another part of the product.
Tradeoff 02
Every voice response needed a matching visual design, so voice could not work as a standalone feature.
Decision 03
Design document search around recognition.
Finding a matching manual, drawing, or report was only part of the job. Operators still had to tell whether the result was actually the document they needed. I reviewed OCR-converted technical documents, including P&ID diagram pages, and looked for recurring identifying information that could help distinguish one result from another.
Tradeoff 03
Designing better previews meant reviewing OCR-converted documents by hand to find identifying patterns before any screens were designed.
04 DELIVERY
Carry the interaction model through edge cases and implementation.
My role was to translate established research, requirements, and domain knowledge into operational interfaces, information architecture, voice patterns, document-retrieval workflows, and interaction behavior engineering could build.
A big part of my work was the voice logic itself. I designed many of the voice commands and worked through the rules with engineers: which words triggered which command, how spoken requests broke down by sentence structure, and the if-this-then-that logic for what the system did next. I also mapped how OCR-converted documents would be searched and designed the results screens each voice command led to. That meant setting the rules for what showed up where, when, and why, what triggered it, and where a user could stay hands-free versus where they had to touch the screen to continue.
As the flows became more detailed, more edge cases surfaced: requests the system did not understand, several valid results for one question, notifications interrupting a conversation, and users needing to recover without losing the task they were already working through.
I mapped those states and adjusted the interaction model as they came up instead of treating the original flow as finished. I stayed close to product and engineering as the work moved toward implementation. When a missing state or unclear behavior surfaced, I revised the design and worked through the expected behavior with the team.
The visual work followed the same approach. I used hierarchy and grouping to make the current condition or answer easy to find while keeping supporting technical detail available underneath it.

Edge-case flows covered interruptions, unsupported requests, notifications, and failures instead of assuming every conversation would follow the happy path.
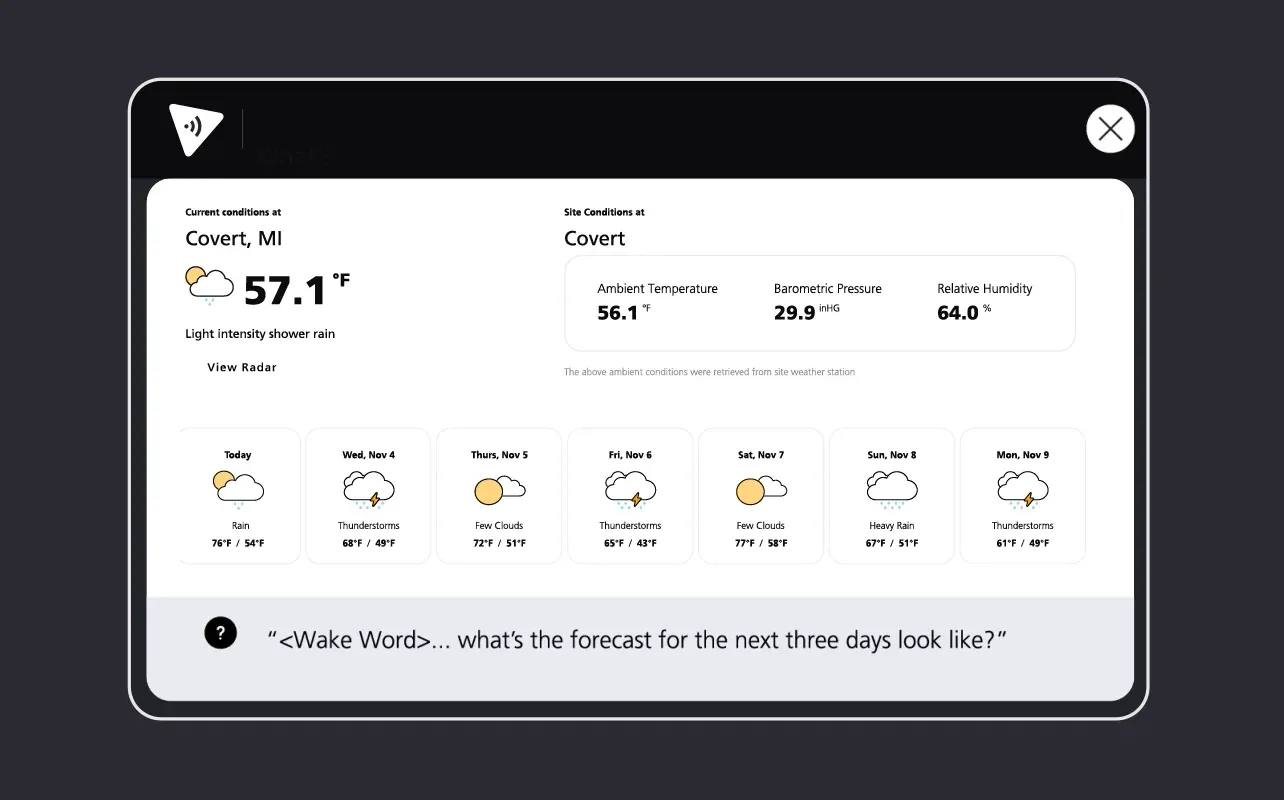
The weather interface surfaced severe conditions and approaching weather events so operators could anticipate potential impact before it affected plant operations.
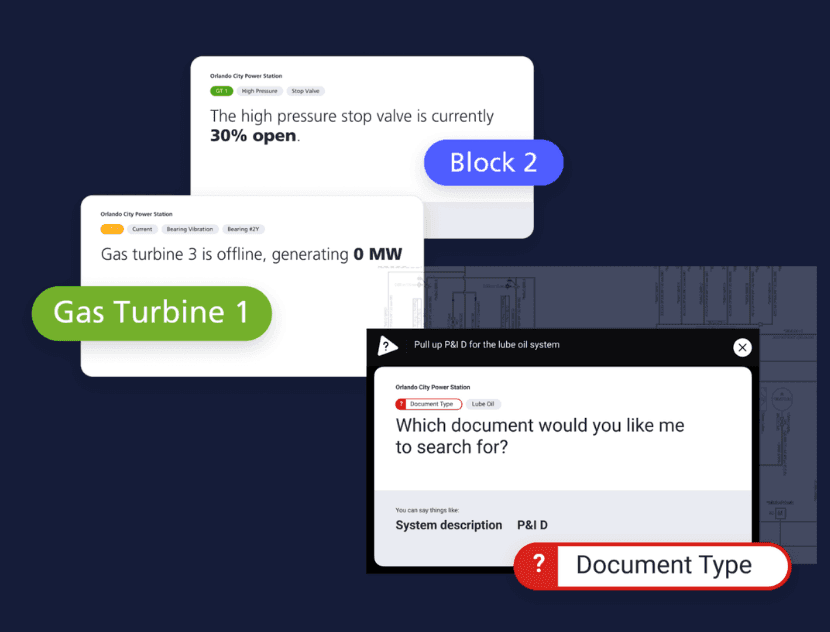
Operational values were presented with clear hierarchy so users could identify the current state before digging into supporting detail.
05 IMPACT
The work became part of a platform operating at global industrial scale.
My work contributed to TOMONI Hub, an enterprise operational intelligence platform supporting more than 145 connected power plants and more than 680,000 live operational data points. My contribution focused on the interfaces and workflows connecting operational monitoring, technical information, voice interaction, and document retrieval.
These figures describe the published scale of the broader TOMONI platform, from AVEVA's Mitsubishi Heavy Industries case study. They are context for the environment I was designing within, not individual performance metrics. Launch by NTT DATA also published a case study on TOMONI Voice.

The product supported teams working across dense monitoring environments where equipment states, alerts, and operational data had to be interpreted quickly.
06 REFLECTION
I learned to pay attention to where the evidence ended.
I joined TOMONI after the initial research phase, so I was often working from existing findings, stakeholder knowledge, operational requirements, and subject-matter expertise instead of direct access to the people using the product every day. When new questions surfaced, I pushed for additional validation where I could. When direct access was not available, I worked with the project manager and subject-matter experts to review the workflow, question assumptions, and work through what we could support with confidence.
When I inherit research or an established product direction now, I want to understand which decisions are supported by evidence, which came from domain expertise, and which still need validation. TOMONI also changed how I think about complexity. Power-plant operations are complex because the work itself is complex. The product still had to respect that. My job was to make that complexity easier to move through without pretending it was simpler than it really was.

